The decline Friday in $SPX, $INDU, & $NDX appears to be little more than a scratch. But several key sectors and indexes took a pretty serious hit.
IWM was down 1.37% Friday and 2.03% for the week. Still up better than 2% for the month.
$NYA lost 1.10% Friday.
$TRAN lost 1.04% Friday and 2.14% on the week.
I don’t necessarily follow Dow Theory but I do follow the transports as a market bellwether and I’ve been mentioning signs of weakness in this key index. On Friday, the 5EMA crossed down through the 10EMA, the -DI line crossed up through the +DI line, and both Sto’s that I use on this chart are in ‘sell’ mode. $TRAN could easily bounce on Monday, as that’s the way the market often goes, but it will probably be a dead cat bounce and then more of the downside action, IMHO. If $TRAN does not right itself early next week, then the weight of this key index will drag the market down right along with it.
$NYA, another important and very broad index, lost some ground Friday and I have found that $NYA can often signal turning points in the market by producing a much larger red candle than is produced by $SPX or $COMPQ. The red candle seems out of place and usually is followed by several rally days, but then the bottom falls out of the market as the big red candle was a shot across the bow not just an anomalous one day event.
The reason why my tone seems so dire is because of the huge overboughtness that has been in the market for nearly three weeks. A big red candle in $NYA any other time would cause me concern but I would expect dip buyers to rush the gates in the following session and then we’re off to the races again. Froth-mouthed dip buyers may well rush the gates Monday, but, IMHO, it won’t be long before they regret their actions.
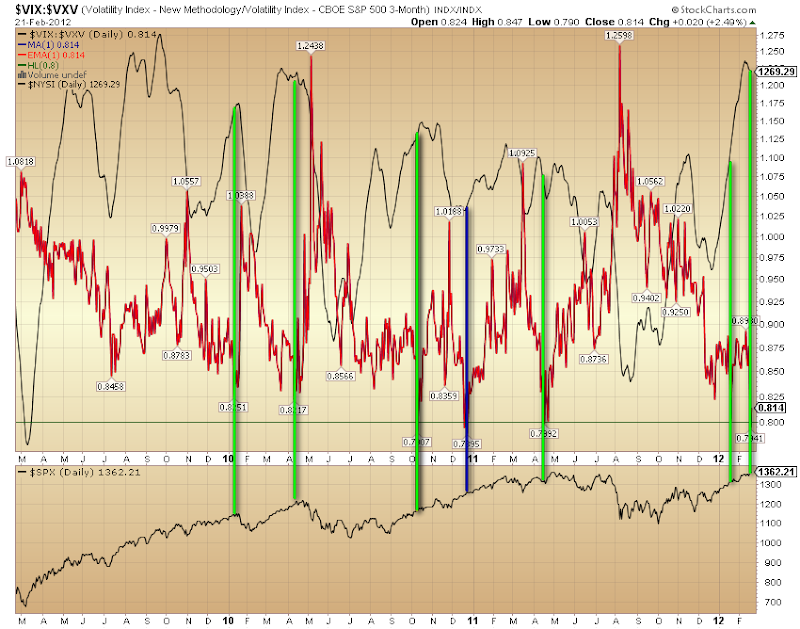
$NYSI, the big daddy of all breadth indicators, produced a negative tick on Friday of -17.83pts. This indicates that the loss of momentum that has been showing up in this index has come out from behind the curtain as the selling, which is always going on as the markets rise, has gone from being covert to being overt. $NYSI is several days away from giving a sell signal, which would occur when the 5EMA crosses down through the 10EMA on this chart. By then there will probably be signs of distribution all over the place, if you catch my drift.
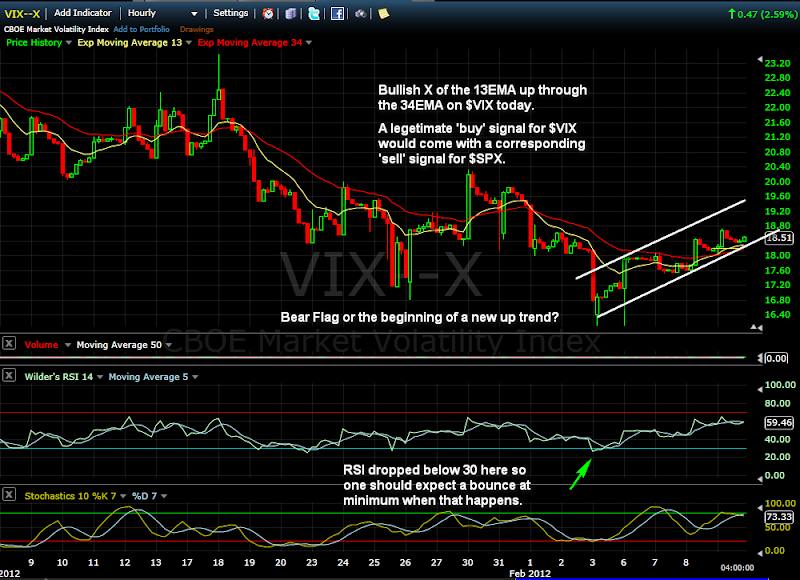
60min chart of SPY as a proxy for $SPX. Per the 60min trading strategy we do not have a valid ‘sell’ signal for the $SPX as SPY is holding above the lower, redrawn, trend line and there is no 13/34 Bearish X. It is very close. Should SPY drop below 134.00 and $SPX drop below 1340 on Monday, then that would doubtless trigger a legitimate ‘sell’ signal in the 60min time frame which could easily become a ‘sell’ signal in the daily chart of this key index.

Chart courtesy of FreeStockCharts.com
Daily chart of $SPX using the faster moving 5/10Method. You can see that while the 5EMA is still above the 10EMA they are both rolling over. The 5,3,3 Sto is flashing a sell signal but the 20/20 Sto still has a couple of days to go before it says it’s time to sell. BTW, I figured out what was wrong with Wilder’s so it is accurate now.
Bulls would take a look at this chart and say: “Ho, Hum. Seen it before. JBTFD.” And that’s a good thing because I am still holding a few shares of UPRO.

Weekly chart of $SPX showing my three preferred MA’s all moving up but there are red flags with the drop in the RSI and the bearish Sto X. Still the chart looks good though I do believe that is about to change.

Rallies don’t just end without a fight so I do expect that the market will move higher in the short term. The wild card, of course, will be news out of Europe and Greece. Even if we get good news and the market rallies early next week, it’s not going to change the fact that the market is very overbought and that the $NYSI is exhibiting weakness which the indexes can ignore for only so long.
Be Careful and GL in the week ahead.